


ECONOMY: Consistent Outlook For 2023
Tulsa’s economy is steadily rebounding over the past year. The Q4 unemployment rate rose 0.1% from Q3 to 3.4% (up 0.7% year over year (YOY)) and the current workforce has dropped 33k from Q3 to 461k (up 21k YOY).
DEMAND: The Market Is Improving Ahead Of The New Year
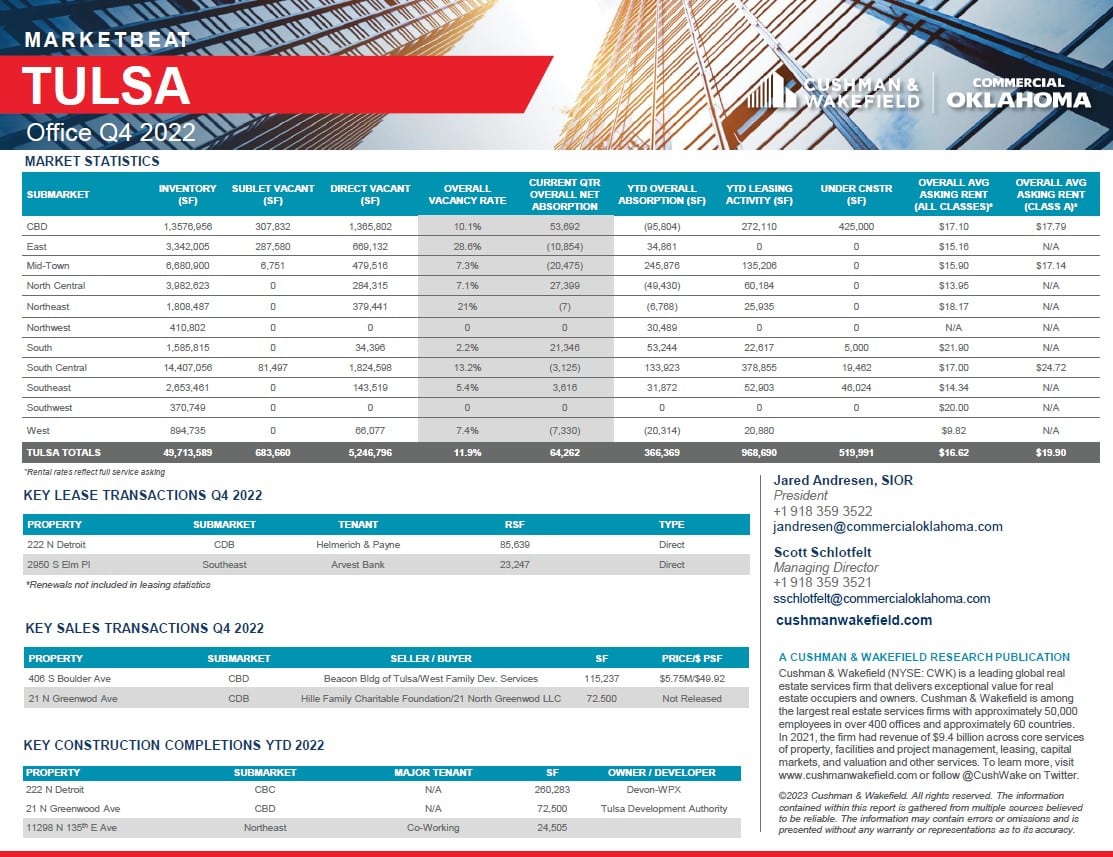
Steep move-outs are in the rearview mirror as the market is reporting net absorption in the black through late 2022. Net Absorption has made a sizeable shift YOY from 170k to 366k in Q4 2022. The vacancy rate has decreased from 14.5% to 11.9% in the same timeframe. Through the fourth quarter, CoStar is reporting a total of 283,000 square feet (sf) of move ins by the end of 2022. While the market’s vacancy rate remains elevated, demand’s inflection point keeps vacancies from rising further. As of Q4, the market
reported 388 new leases totaling 1 million sf along with 283,000 sf of move ins. The average deal size was 2,900 sf.
Despite ongoing uncertainty surrounding the office market, the area is reporting annual rent growth of 1.6%.
PRICING: Small Market Rent Increase For Q4
The Tulsa total market saw a $.05 per square feet (psf ) increase finishing the quarter at $16.62 psf , with the total Central Business District (CBD) showing a $.06 ($17.10/ psf ) decrease and Non CBD a $.07 ($16.37/ psf ) increase. Class A space continues to struggle with fluctuations in demand. Total Class A vacancies were up .5% (up 2.2% YOY) within the CBD and Non CBD Class A vacancies were down .3% (down 2.3% YOY).
The highest rents are found in the metro area outside of the CBD. The South submarket has the highest asking rent at $21.84/psf followed closely by the Northeast and Southwest submarkets at $20.00/ psf , and all rank ahead of the CBD with a near $ psf premium at $17.10/psf. Due to continued consolidations and closing in the downtown area, the CBD has struggled to see any significant rent gains.